Welcome to my 7th grade science blog!

Saturday, June 11, 2011

Summary of End of Year Reflection Questions

In class, we filled out a sheet with question about our experiences in science class this year (and possibly your experiences in previous years with our teacher, Mrs. M, depending how you interpret the questions.) We had a substitute teacher, so I'm not 100% sure what we are supposed to do, but I think that I should write a summary of what I wrote on that sheet.
I don't remember everything I wrote on the paper, so I'll type what I remember.
One of the questions I distinctly remember was along the lines of "What are some of your memorable experience in science class?". I chose to talk about both 6th and 7th grade, because I'm leaving ISB, so I think about science class as a whole 2-year experience, not as two 1-year experiences. I wrote that one of my most memorable experiences in science class was the marble theme park that I did with Luka and David last year. I remember that because it was very stressful for me, and I didn't end up doing very well in the end.
Another question I remember on the paper was "Which was your favorite unit this year?" and I answered by talking about the ultimate survival unit. I chose that as my favorite because it was different than a normal unit.
An additional and final question that I remembered was "What was your least favorite unit this year?" which I answered with "the space unit." I chose that because I thought that the space unit was a bit rushed at the end of the year and I'm not interested in space in general.

Friday, June 10, 2011

Make an Impact Lab

Guiding Question: What are the factors that affect the appearance of impact craters?
My Hypothesis: I think that the mass, speed and angle of the meteor affect the appearance of impact craters because they affect how deep the floor of the crater is and how far the walls of the crater are from each other.
Materials:
  • Safety goggles
  • tray
  • flour
  • notebook
  • spoon
  • small and large marbles
  • ruler (cm)
  • Excel
  • Word
I performed these tests with my lab partners, Brin, Ergi and Jan, and here are our results:
And from that data I produced these graphs:


Data Analysis:
This is a lot of data when you look at it. Analyzing it wasn't easy. I found that it was much easier to see trends in the graphs, rather than the raw data.
From what I see in my graphs, I can tell that the length of the eject is most affected by the height of drop. In our miniaturized version of Earth and meteors, the height of the drop also affected speed, so I can say that the speed that the meteor is falling has a great impact on the length of the ejecta from the collision. I can also see that the faster the meteor is falling when it hits earth, the deeper the crater will be. The speed of the meteor has a significant impact on the depth of the crater. An additional observation that I can make from my data and charts is that the speed of the meteor does not have a large impact on the diameter of the crater. That logically makes sense. Even when the meteor is falling extremely fast, it can't leave a crater that is all that much  bigger than the meteor itself.
Conclusion: My guiding question was "What are the factors that affect the appearance of impact craters?". Through my testing, I found that the speed of the meteor has a significant impact on the depth the crater and length of the resulting ejecta, but the speed does not have a significant impact on the diameter of the crater. My hypothesis was inaccurate because it didn't relate to the testing that I did. So I guess it counts as "incorrect."

Tuesday, June 7, 2011

Satellites Lab


TITLE:  Satellites in Orbit Lab

I.  GUIDING QUESTION: How does the mass as well as the distance from earth impact how a satellite stays in orbit?

II.HYPOTHESIS:

Adrian’s Hypothesis:
I think that the heavier the satellite, as well as the further from earth it is, (the longer the string is) the more inertia the satellite has and the longer it will stay in orbit.

Exploration (PLAN & DO A TEST):
         Materials:
  1. 3x String or Fishing Wire (one that is 40 cm, one that is 80cm, and one that is 140cm)
  2. Metal Rings
  3. Ruler
  4. Notebook


Variables:
Manipulated:
  • Mass of satellite
  • Distance of satellite from gravity source


Constant:
  • Force of gravity


Adrian’s and Rafa’s Procedure:
  1. Tape together the amount of metal rings you are testing (1, 2, 3 or 4).
  2. Then securely tie the bundle of metal rings to the string length that you are testing. (40, 80, or 140) You have now made a pendulum.
  3. Swing the pendulum above your head at a constant rate.
  4. Observe in a data table how well the pendulum swings at different strengths.


Maria’s Procedure:
  1. Take the fishing line and loop it through the holes of the four metal.
  2. Securely tie the string.
  3. Slowly start swinging the pendulum, raising it up above your head.
  4. Write down your observations, changing the mass of the pendulum (1-4 metal rings) and the length of the string (40cm- 80cm-120cm-160cm )


Observations
1 weight2 Weights3 Weights4 Weights
40 cm stringIt was light, easy to spin fast, if it were a planet it wouldn’t have much gravity. It hung down slightly, which wouldn’t have happened with more weights.Much harder to swing, would have more gravity as  a planet. Was basically level as it swung.Was actually easier to swing because inertia kept it in motionMaria’s arm started to swing, slightly harder to swing than 3 weights but easier than 2 weights.
80 cm stringActually quite easy to swing. Observed that the longer the string and the smaller the mass, the easier it is to swingHeavier, you can feel the slight weightiness.“It’s heavy.” It wants to fly away. “Like the two ring, but heavier.”“Ow! It hurts!” Very powerful inertia. If you tried changing directions, it would take longer.
140 cm stringTakes less power to swing. Feels really light.Extreme inertia, cannot switch directions.Very resistant to change, has a lot of energyVery very powerful.Takes a lot of power to swing. Tilts more.


Adrian’s Data Analysis
In this lab, the amount of rings being tested represented the mass of the satellite, and the length of the string represented how far from Earth the satellite is. (I felt that I didn’t make that clear enough, which could have led to some misunderstandings.) I think that our data clearly shows that the heavier the weight is, the more inertia it has and the longer it would stay in orbit if it were a satellite. However, the length of the string had an even bigger effect on the inertia and longer string gave the weights, or “satellite” much more inertia. it relied on Our data mostly showed accuracy, but it relied on written observations rather than measurements. Because observations are subjective, the results could vary from person to person, which creates some inaccuracy.

Adrian’s Conclusion:
My guiding question was “How does the mass as well as the distance from earth impact how a satellite stays in orbit?” I concluded that the longer the  distance of the satellite from earth and the larger the mass of the satellite was, the more inertia it has and the longer it could stay in orbit. That is pretty much what I hypothesized, so my hypothesis is correct.


Adrian’s Further Inquiry:
The validity of our data was not so great this lab because all of our data was simply observations rather than measurements. That means that if someone else tried to replicate this lab, they would probably have a different-looking data table with different comments. However, the data was accurate enough for me to find clear patterns and determine the meaning from our results. If I were to do this lab again, I would be more scientific in swinging the pendulum at exactly the same speed in each test, and I would find some way to measure the results in addition to the comments.

Sunday, June 5, 2011

Current Events - Furthest Object Ever Seen

On April 29, 2011, NASA's Swift satellite spotted a gamma ray burst. It turned out to be a very important gamma burst indeed. Named GRB 090429B, the gamma burst is 13.14 billion light years from earth. The universe is only 13.7 billion years old anyway, so finding an even older object will be difficult. When the gamma ray burst occurred, the universe was 1/10 of the size it is now, and 1/25 of its current age. Apparently the burst of gamma rays spawned in one of the earliest galaxies that existed in our universe. Unfortunately our current observatories and telescopes can't see that galaxy, but it's possible that future ones will be able to. It's also possible that this isn't actually the furthest object ever seen, because accuracy in measurement is difficult when the object is so far.
I find this interesting. I'm sure that astronomers will probably find a further object before long, but it's interesting to know that we as humans can see things that happened 13.14 billion years ago, long before we or even earth existed. It makes me feel like humans are more powerful than the universe, that we can observe things that we took no part in. This all very interesting, but I also don't think that it is very useful. It doesn't help us solve our problems, and so far it hasn't led to any significant discoveries about the creation of the universe. 

Wednesday, May 25, 2011

Moon Phases Lab

I followed these directions to do a lab about moon phases.
Reflect about the various ways we explored the phases of the moon to help us to understand how they occur. 
We explored the phases of the moon in two different ways: we used our own, physical model, and we used the simulator. I think that the physical model was better, because I made it myself and it was easier for me to understand. 
 When investigating the simulation, the moon clock, and/or the model, what did you notice about the phases of the moon? Why do we see different parts of the moon each night?
From a top down view, the moon is always illuminated on the same side. However, the moon moves around the earth, so it appears that sometimes one side is illuminated and sometimes the other is illuminated.
How well did making a model help you understand the phases of the moon? What are some disadvantages of using models?
I think that the model helped because I was involved in each step of making it, so I knew exactly how it worked. It was also simple to understand. However, one disadvantage of the simplicity is that it wasn't complex enough to cover all possible situations. 
Scientists are thinking all the time about how they can make models of objects that are too small or too large to see: Can you think of another way to make a model to represent the various phases of the moon?
It's hard to think of another model. Maybe a laser and tiny matte white marbles would work.
What is a lunar month?
A lunar month is the time it takes for the moon to make one complete circle around the moon. It takes 29.5 days.

Tuesday, May 10, 2011

What I Want to Learn this Unit

I'm not so sure exactly what I want to learn this unit. Here's a list that I brainstormed:

  • I want to learn about black holes
  • I want to learn about various NASA programs
  • I want to learn about how far we could get using the fastest modern rockets
  • I wonder if there would be any other way to get things into space besides using rockets.

Monday, May 9, 2011

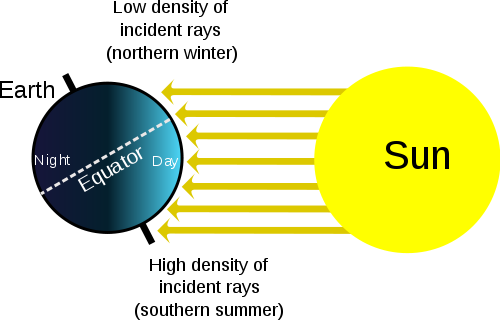
Reasons for the Seasons Lab

Guiding Question: How does the tilt of Earth's axis affect the light received by Earth as it revolves around the sun.
Hypothesis: I think that the tilt of the Earth determines the amount of light received by earth.When it is tilted to the left, and the sun is on the right, the southern hemisphere is gets more light, which means that it is summer in the southern hemisphere.


1. When it is winter in the Northern Hemisphere, which areas on Earth get the most concentrated light? Which areas get the most  concentrated light when it is summer in the Northern Hemisphere?
When it is winter in the northern hemisphere, the southern hemisphere gets the most concentrated light. When it is summer in the northern hemisphere, the northern hemisphere gets the most concentrated light.
2. Compare your observations of how the light hits the area halfway between the equator and the North Pole during winter and during summer.
When it is winter in the area halfway between the north pole and the equator, it is dark there and little light falls on it. When it is summer there, lots of light falls on it.
3. If the squares projected on the ball from the acetate become larger, what can you infer about the amount of heat disturbed in each square?
If that happened, there would be more total heat in each square.
4.  According to your observations, which areas on Earth are consistently coolest? Which areas are consistently warmest? Why?
The north and south poles are the coolest areas. The equator is a warmer area.
5. What time of year will the toothpick's shadow be the longest? When will the shadow be shortest?
The shadow is longest spring and fall. The shadow is shortest during summer.
6. How are the amounts of heat and light received in a square related to the angle of the sun's rays?

The more directly the light/heat hits the square, the more intense the heat/light are. For example, if the light/heat hit Earth directly level, at 180 degrees, it will be warmer than if it hits the Earth at 45 degrees.
7. Use your observations of an Earth-sun model to write an explanation of what causes seasons.

The seasons exist because of the Earth's tilt. The tilt remains the same as the Earth moves around the Sun, so during some parts of the year, more light shines on the top of the Earth (northern hemisphere) and more light shines on the bottom of the Earth (southern hemisphere) during other parts of the year. 


Conclusion
My partner and I both had problems understanding the instructions for this lab, but we did eventually figure it out. We found out that seasons depended on the position of the earth's tilt in relation to the earth. The earth's tilt doesn't change as it moves around the sun, so when the earth is in certain positions, some areas of the earth get more sun than others, and it is summer there. This is essentially the same as my hypothesis, so I was correct.

Sunday, May 1, 2011

Unit Reflection: Waves All Around Us

Our wave unit is done, and as usual, I need to write a unit reflection.
I'm supposed to create bubbl.us mind map, which I'm not good at. I did my best, and I think that this one isn't as much of a failure as some of my previous attempts have been.
Click on the image to make it larger.
Our unit question was "How does the use and study of waves affect societal well-being?". Just like any other unit question, the question is very broad and difficult to answer in a short sentence. (I'm sure whoever thought of this question did that intentionally!) My answer is:
The use and study of waves affect societal well being in a variety of ways. The study of seismic waves can help scientists detect earthquakes before they happen and make sure that people who live in the area where the earthquake will hit evacuate before the earthquake. This affects societal well-being because it can prevent the death of millions of people. A similar use of the study of seismic waves is to detect tsunamis. The study of sound waves can also help engineers design and plan roads and buildings so that noise pollution is not a problem. For example, the engineers would need to know how sound bounces off surfaces so that they know what kind of sound barrier to put by a highway, and where to put it. The way that this affects societal well-being is that it can help prevent noise pollution, which is a problem in many large cities. An additional use for the study of waves is study of how gamma rays affect people's health. Scientists study that to learn whether the irradiation of food is safe or not. To conclude, the study of waves is very beneficial to society because it can eliminate problems and even save lives.

(Within my answer, I embedded some links to my related blog posts if you want more information about each topic.)

I had a couple more questions to answer:
What did you learn during the unit?  (Looking at the picture you drew-how has your knowledge changed?)  
For those of you who don't know, at the beginning of the unit our teacher, Mrs. M, put on music and told us to draw whatever we thought of related to waves. I scanned in my picture so you can see it. It's not very good, but then again, I'm not much of an artist.
Again, click to make it larger.
During this unit I learned many things. I learned about different types of waves, and which types require mediums. I learned how the Doppler effect works, and how X-Rays can see bones. One big thing that I learned is that studying waves actually helps the world and saves lives, and waves aren't just "some sort of science thing". In my drawing, I was thinking of waves only as a scientific part of our lives. I wasn't thinking of waves as earthquakes and food irradiation, both of which are things that can change lives for the better or the worse.

What did you like? 
I thought that devising my own lab involving waves was fun, because it allowed more creativity than a lab where I am told what to do and how to do it.
What would you change or add for next year's grade 7 students? 

I think that it would have been fun to do a lab involving electromagnetic waves, but that might require special equipment to do. It could be something simple, like learning how WiFi works, and testing the range of the school's WiFi, and finding out what frequency it is on. (Hint: 2.4 gigahertz!)


Wednesday, April 20, 2011

Food Irradiation

In class, we had a debate about food irradiation. Half of the class had to argue that it was bad, and half of the class had to argue that it was good. We had about 30 minutes to research and prepare our arguments. I was assigned to argue that Irradiation is good, which is lucky for me because that is the opinion I had before the debate. The debating was fierce, but I think that both sides made some valid arguments. Our final conclusion at the end is that foods such as eggs and meat that commonly transmit harmful bacteria should be radiated, but foods that do not should not be irradiated.
Our arguments included:
  • The FDA, CDC and UNWHO all conclude that food irradiation is safe
  • Food irradiation is a safer method than pesticides of removing bacteria from some food
  • Food irradiation can make some food last longer
Some of my opponents' arguments included:
  • Food irradiation can destroy some vitamins in food
  • Food irradiation, just like anything involving radiation, may cause cancer

I was also supposed to answer question #3 from page 89 in my textbook, "Science Explorer - Sound and Light". The question was:
You see two containers of a food at the supermarket. One is irradiated; one is not. The price is the same. Which would you buy? Explain why.
I would choose the irradiated food, because there is a lower chance of harmful bacteria being in the irradiated food than in the non-irradiated food.

Thursday, March 31, 2011

Noise Pollution

What would you do if your neighbor was having a loud party while you were trying to sleep? First, you would probably tell him to quiet down. If he didn't, you might have to resort to calling the cops. Although this incident may be small, your neighbor is contributing to a bigger problem known as noise pollution.  Noise pollution is loud environmental noise that disrupts things. It is a big problem with potentially devastating effects on health.
A more formal definition of noise pollution than my definition is "annoying and potentially harmful environmental noise".  It can happen almost anywhere in the world, and is contributed to anything that makes loud noise. Noise pollution is more than just an annoyance though. A study in 2007 done by the WHO (World Health Organization) showed that noise pollution causes around 210,00 deaths in europe every year. Noise pollution kills by causing stress, inflammation and ischaemic heart disease. It can also cause sleep and hearing loss. Rudimentary tools like earplugs or earmuffs both offer protection from noise pollution, but noise pollution causes problems from exposure over time, so these methods are not the best. Because much of noise pollution comes from cars, a better and more effective way to limit noise pollution is through the use of noise barriers. Noise barriers are structures that are designed to prevent noise from escaping from roads and into people's ears. Here is an example of a noise barrier:
 Another common cause of noise pollution is from airplanes, especially when airports are located close to residences. An effective way to limit noise pollution from airports is through the use of quieter airplanes. Modern airplanes are much quieter than older planes, and they continue to get quieter. For example, the airplane maker Boeing advertises its new 747-800 plane as quieter than other comparable jets, as well as the previous generation 747 plane.
I feel that I have personal experience with noise pollution, because I live in the heart of the city, in Dorcol. Whenever I go to bed, I can hear buses, people shouting, dogs barking, cars honking and other sounds. They are quite loud, and if I focused on them they would be quite annoying. However, I found that after I lived in my apartment for a while, I stopped noticing all the noise. It was as if my brain was filtering the noise it wanted to hear.
Noise Pollution is a big problem, but it isn't a problem that will go away easy. It will be difficult to solve because many of the things that we use in modern life, like cars and planes, cause noise pollution.

Bibliography


Jarup, Lars. "Hypertension and Exposure to Noise near Airports (HYENA): Study Design and Noise Exposure Assessment." EBSCO. Web. 31 Mar. 2011. .

"Noise Barrier." Wikipedia, the Free Encyclopedia. Web. 31 Mar. 2011. .

"Noise Pollution | Air and Radiation | US EPA." US Environmental Protection Agency. Web. 31 Mar. 2011. .

"Noise Pollution." Wikipedia, the Free Encyclopedia. Web. 31 Mar. 2011.
"Boeing: Commercial Airplanes - 747 - Boeing 747-8 Intercontinental and 747-8 Freighter." The Boeing Company. Web. 31 Mar. 2011. .

Density Lab


DENSITY LAB

I.  GUIDING QUESTION: How does the density of various solids affect the way the sound waves travel from a tuning fork?

II. HYPOTHESIS
                         Hypothesis (Adrian): I think that increased density of the medium might cause the sound waves to travel faster, but be quieter.
                         Hypothesis (Jude): The density will cause the pitch to increase although the loudness will not change.
                             
III. EXPLORATION
                         A. Materials:
  • Wood
  • Plastic
  • Ream of Paper
  • Rock
  • Sponge
  • Cement/Concrete
  • Tuning Fork (341.3F)


                         B. Procedure:
  1. Find desired materials. Measure or research to find their density.
  2. Set up a table in your notebook with three headings: Material, Density and Loudness/Pitch/Observation.
  3. Tap the side of the tuning fork against each material. Remember to always stay the same distance away from the tuning fork and to keep your tests in a room with the same temperature.
  4. Write down your observations in the Loudness/Pitch/Observation category.

IV.  RECORD & ANALYZE
                                          A.  Data Tables:
                       
Material
Density
Loudness/Pitch/
Observation
Wood
680 kg/m(3)
High at first but softens to a medium pitch. Very empty loudness.
Polycarbonate Plastic
1360 kg/m(3)
A low, soft pitch. Loud.
Ream of Paper
94 kg/m(3)
Very loud, low pitch.
Volcanic Pumice
641 kg/m(3)
A medium pitch with a soft, rumbling after-effect. Not very loud.
Sponge
100 kg/m(3)
Extremely soft, almost no volume. Normal pitch.
Cement
1100 kg/metres(3)
Starts low, but rises to a medium volume. Low pitch.


C.  Analysis of Data (Adrian): I found that most of the time, the denser the material was, the lower pitch it had. However, density had no significant effect on the loudness. I wasn’t here while my lab partner Jude was doing these test, so it is difficult to make as many observations.
                
Analysis of Data (Jude): The lower pitch in some of the materials comes from the sound waves traveling through dense material. The rumbling from the Volcanic Pumice is from the rock itself. The crumbly, rough top would produce a rumbling. The ream of paper is unique because it is thick, therefore has the properties of dense material. The less dense materials produced a medium to high pitched sound. The sponge produced almost no sound because it was so soft and had an extremely low density.
                                         
IV. CONCLUSION
                            Conclusion (Adrian): My hypothesis was “I think that increased density of the medium might cause the sound waves to travel faster, but be quieter.” I found out that denser mediums caused a lower pitch, but didn’t have an effect on the volume of the sound. My hypothesis was completely wrong. I learned that different properties of the medium can effect the sound in different way, so sound won’t necessarily travel the same way in two materials with the same density.
                          
                            Conclusion (Jude): My hypothesis: “The density will cause the pitch to increase although the loudness will not change,” was proved sort of correct. It really varies from material to material. From the data table we can see that the denser the material the lower and louder the sound. This is because the particles are more compact therefore when they vibrate together they produce a greater sound.

V. FURTHER INQUIRY
                                     Further Inquiry (Adrian): I realized that there was a fatal flaw in out experiment that made all of data mostly invalid. We were supposed to be testing how density of various mediums effected how sound travels. So the density of the medium was supposed to be the variable, and all other factors such as the elasticity of the medium were supposed to remain constant. However, in our experiment we changed the density and elasticity whenever we changed mediums, so we couldn't be sure if the patterns we noticed in our data were because of the change in density or the change in elasticity. To avoid this next time, we would need to find materials with exactly the same elasticity, but different densities. Although that would be difficult to find, it would be necessary for our experiment to be truly scientific.

                                     Further Inquiry (Jude): For a start, I could have definitely had Adrian and myself test, but he was away, so I had to rely on my own data. I would have maybe liked to have added a few more materials to the test just to make the testing more interesting. Well after the tests were conducted, Adrian found a flaw that, not ruined our tests, but did change the ideology. We were meant to only manipulate the density, but we ended up in the course of choosing different materials changing elasticity and partially changing the temperature. To avoid this next time we should find different materials with the same elasticity but different density (that would be hard).I would have definitely liked to have changed the frequency of the tuning fork and maybe change the order of testing the items, just to make things simpler. Otherwise I feel that the testing in a nutshell went very well. Another test we could have conducted is measuring the speed of the sound waves and changing the frequency of the tuning fork.